Difference between revisions of "SIPit 25 traffic graphs"
Jump to navigation
Jump to search
| Line 1: | Line 1: | ||
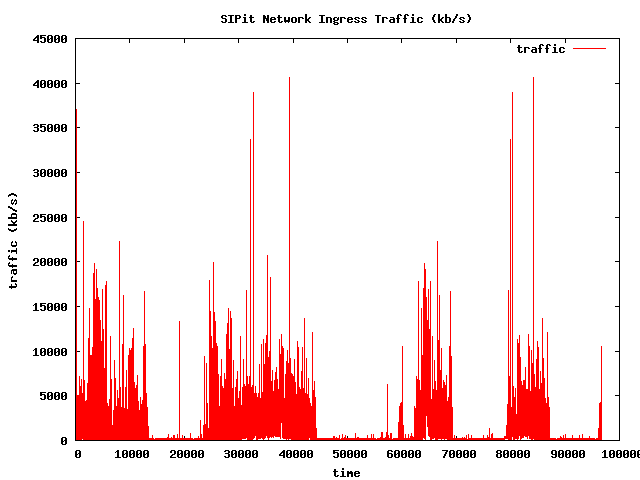
Below are graphs that represent the ingress and egress traffic on the main uplink connection for the SIPit 25 network. | Below are graphs that represent the ingress and egress traffic on the main uplink connection for the SIPit 25 network. | ||
| + | |||
This is '''only''' the traffic leaving and entering the event across the main uplink. Traffic between systems at the event | This is '''only''' the traffic leaving and entering the event across the main uplink. Traffic between systems at the event | ||
is not represented here. | is not represented here. | ||
The graphs show traffic starting Monday at 4:20pm through Friday at 9:30am. The x axis unit is representative of 5 second intervals. | The graphs show traffic starting Monday at 4:20pm through Friday at 9:30am. The x axis unit is representative of 5 second intervals. | ||
| + | |||
| + | SIPit 25 had 66 attendees. | ||
[[Image:ingress.graph.png]] | [[Image:ingress.graph.png]] | ||
[[Image:egress.graph.png]] | [[Image:egress.graph.png]] | ||
Latest revision as of 13:45, 18 September 2009
Below are graphs that represent the ingress and egress traffic on the main uplink connection for the SIPit 25 network.
This is only the traffic leaving and entering the event across the main uplink. Traffic between systems at the event is not represented here.
The graphs show traffic starting Monday at 4:20pm through Friday at 9:30am. The x axis unit is representative of 5 second intervals.
SIPit 25 had 66 attendees.

