Difference between revisions of "SIPit 25 traffic graphs"
Jump to navigation
Jump to search
(New page: Below are graphs that represent the ingress and egress traffic on the main uplink connection for the SIPit 25 network. The graphs show traffic starting Monday at 4:20pm through Friday at ...) |
(added images) |
||
| Line 1: | Line 1: | ||
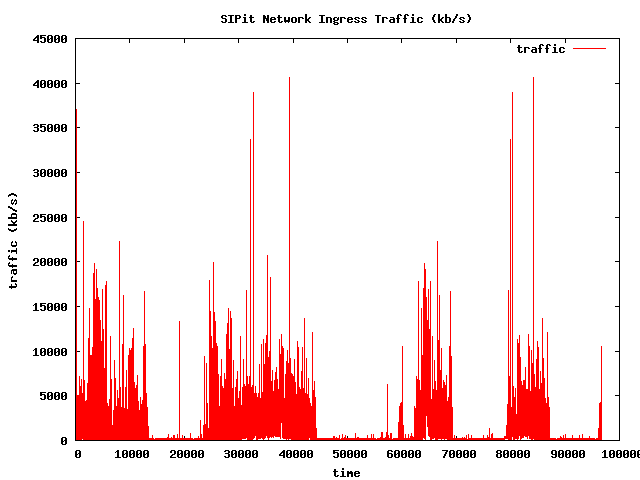
Below are graphs that represent the ingress and egress traffic on the main uplink connection for the SIPit 25 network. The graphs show traffic starting Monday at 4:20pm through Friday at 9:30pm. The x axis unit is representative of 5 second intervals. | Below are graphs that represent the ingress and egress traffic on the main uplink connection for the SIPit 25 network. The graphs show traffic starting Monday at 4:20pm through Friday at 9:30pm. The x axis unit is representative of 5 second intervals. | ||
| + | |||
| + | [[Image:ingress.graph.png]] | ||
| + | |||
| + | [[Image:egress.graph.png]] | ||

